Abstract
A Boolean model is a simple, discrete and dynamic model without the need to consider the effects at the intermediate levels and is powerful in qualitatively describing large-scale system dynamics. However, little effort has been made into constructing activation and inhibition networks, which could indicate the direct roles of a gene (or its synthesised protein) as an activator or inhibitor of a target gene. The major reason for this is that the hypotheses of the current Boolean models do not provide an intuitive way to identify the effects of individual activation or inhibition pathways on the target gene. Therefore, we propose to focus on the general Boolean functions at the subfunction level and further split the subfunctions into the activation and inhibition domains. As a consequence, we developed a novel data-driven Boolean model; namely, the Fundamental Boolean Model (FBM), to draw insights into gene activation and inhibition. This novel Boolean model provided an intuitive definition of activation and inhibition pathways and included mechanisms to handle protein decay issues as well as introducing uncertainty into the Boolean functions. Apart from this new concept, we also proposed a new data mining method to extract fundamental Boolean networks (FBNs) from time series data. To prove the concept of the novel model, we implemented a platform using R language, called FBNNet, based on the proposed novel Boolean model and a novel data mining technique. Our experimental results showed that the proposed FBM can explicitly display the internal connections between genes separated into the connection types of activation and inhibition, and the novel Boolean model was shown to infer GRNs from the time series data generated from an original cell cycle network with a high degree of accuracy. Moreover, the method we proposed to infer the gene regulatory networks for the novel Boolean model can be run in parallel and; hence, the computation cost is affordable. To summarise, the novel Boolean model and related FBNs could show significant trajectories in genes to reveal how genes regulated each other over a given time period. This new feature could facilitate further research about drug interactions to detect the side effects of the use of a newly-proposed drug. (source:https://www.frontiersin.org/articles/10.3389/fphys.2018.01328/full)Introduction
Fundamental Boolean modelling(FBM) has been proposed to draw insights into gene activation, inhibition, and protein decay. This novel Boolean model provides an intuitive definition of activation and inhibition pathways and includes mechanisms to handle protein decay issues. To prove the concept of the novel model, we implemented a platform using R language, called FBNNet. Our experimental results show that the proposed FBM could explicitly display the internal connections of the mammalian cell cycle between genes separated into the connection types of activation, inhibition and protein decay (Chen, Kulasiri, and Samarasinghe "2018").
Experiment
The experiments conducted and described here intend to prove the concept of the new Boolean Model, i.e., the FBM. To verify the results, we apply the general processes described in Figure 1 as a benchmark to compare the results generated via BoolNet (Mussel, Hopfensitz, and Kestler "2010"), with these consequencely reconstructed from the new R package, FBNNet.
knitr::include_graphics("IMAGES/evaluation.jpg")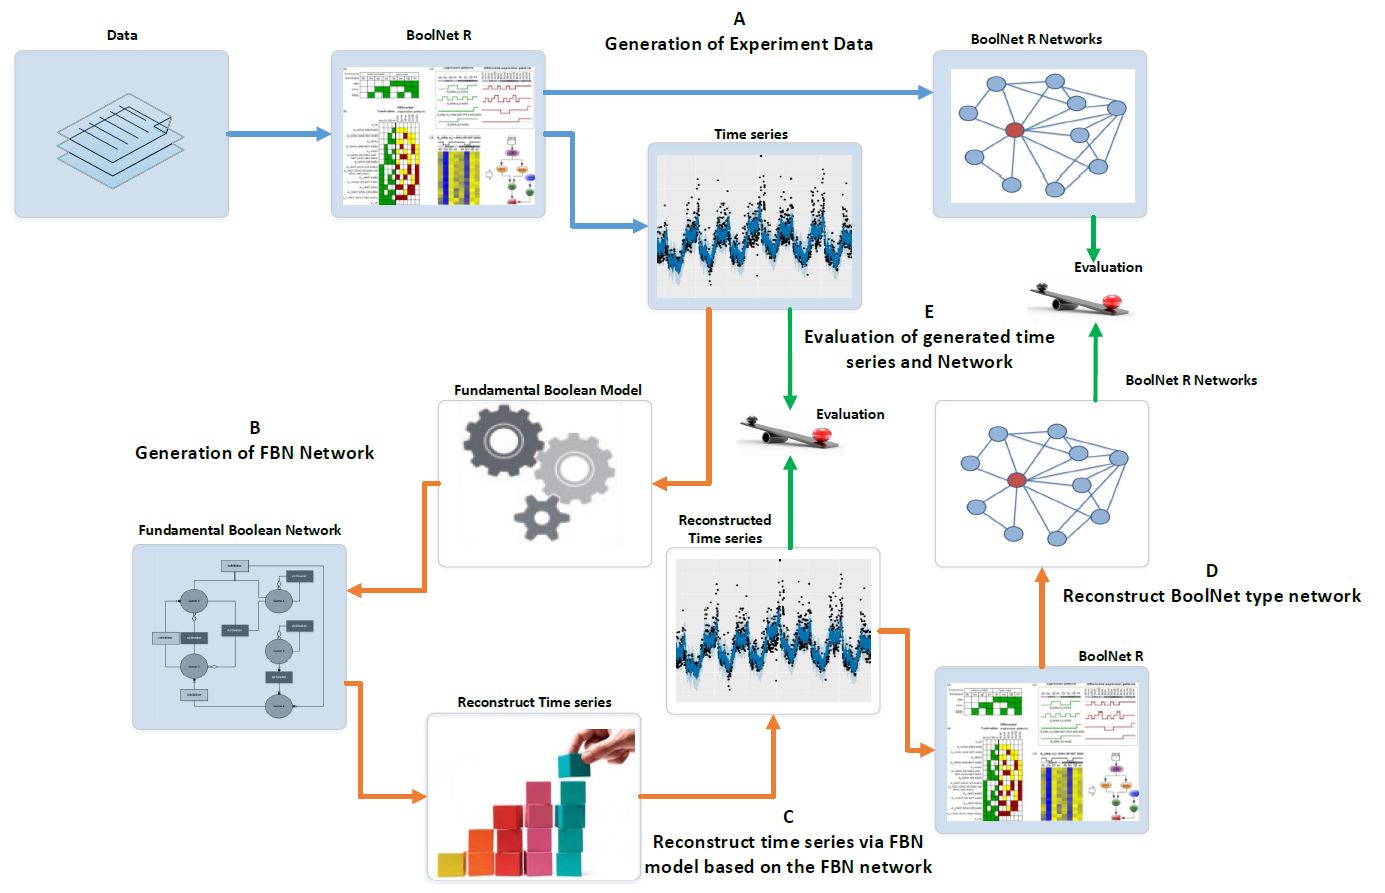
Figure 1 Evaluation assessment of Fundamental Boolean network inference using BoolNet. The blue arrows represent the processes using BoolNet and brown arrows represent the processes using our FBNNet R package. The green arrows represent the evaluation process. (A) We use the BoolNet script loadNetwork.R to load pre-defined networks from files and then generate the time series and networks; (B) We use the time series generated from BoolNet and the new R package, FBNNet, to generate FBNs; (C) We reconstruct the time series via the FBM; this process can be used to expand the short time series data; (D) To evaluate the FBM, we rebuild the BoolNet type network based on the reconstructed time series; and (E) We evaluate the FBN inference methods by comparing the generated time series and the generated BoolNet type of network with the original time series and network that were generated in step A.Data
library(knitr)
library(BoolNet)
library(utils)
library(FBNNet)
library(visNetwork)
data("ExampleNetwork")
ExampleNetwork
#> Boolean network with 5 genes
#>
#> Involved genes:
#> Gene1 Gene2 Gene3 Gene4 Gene5
#>
#> Transition functions:
#> Gene1 = Gene1
#> Gene2 = Gene1 & Gene5 & !Gene4
#> Gene3 = Gene3
#> Gene4 = Gene3 & !(Gene1 & Gene5)
#> Gene5 = !Gene2
Extract the Fundamental Boolean Network
   initialStates <- generateAllCombinationBinary(ExampleNetwork$genes)
   trainingseries <- genereateBoolNetTimeseries(ExampleNetwork,
                                             initialStates,43,
                                             type = "synchronous")
   FBNcellcyclenetwork <- generateFBMNetwork(timeseries_data = trainingseries,
                                 maxK = 4,
                                 max_deep_temporal = 1,
                                 useParallel = FALSE,
                                 verbose = FALSE)
   print(FBNcellcyclenetwork)
#> Fundamental Boolean Network with  5 genes
#> Genes involved:
#> Gene1, Gene2, Gene3, Gene4, Gene5
#>
#> Networks:
#> Multiple Transition Functions for Gene1 with decay value = 1:
#> Gene1_1_Activator: Gene1 = Gene1 (Confidence: 1, TimeStep: 1)
#> Gene1_1_Inhibitor: Gene1 = !Gene1 (Confidence: 1, TimeStep: 1)
#>
#> Multiple Transition Functions for Gene2 with decay value = 1:
#> Gene2_1_Activator: Gene2 = Gene1&!Gene4&Gene5 (Confidence: 1, TimeStep: 1)
#> Gene2_1_Inhibitor: Gene2 = !Gene1 (Confidence: 1, TimeStep: 1)
#> Gene2_2_Inhibitor: Gene2 = Gene4 (Confidence: 1, TimeStep: 1)
#> Gene2_3_Inhibitor: Gene2 = !Gene5 (Confidence: 1, TimeStep: 1)
#>
#> Multiple Transition Functions for Gene3 with decay value = 1:
#> Gene3_1_Activator: Gene3 = Gene3 (Confidence: 1, TimeStep: 1)
#> Gene3_1_Inhibitor: Gene3 = !Gene3 (Confidence: 1, TimeStep: 1)
#>
#> Multiple Transition Functions for Gene4 with decay value = 1:
#> Gene4_1_Activator: Gene4 = !Gene1&Gene3 (Confidence: 1, TimeStep: 1)
#> Gene4_2_Activator: Gene4 = Gene3&!Gene5 (Confidence: 1, TimeStep: 1)
#> Gene4_1_Inhibitor: Gene4 = !Gene3 (Confidence: 1, TimeStep: 1)
#> Gene4_2_Inhibitor: Gene4 = Gene1&Gene5 (Confidence: 1, TimeStep: 1)
#>
#> Multiple Transition Functions for Gene5 with decay value = 1:
#> Gene5_1_Activator: Gene5 = !Gene2 (Confidence: 1, TimeStep: 1)
#> Gene5_1_Inhibitor: Gene5 = Gene2 (Confidence: 1, TimeStep: 1)
FBNNet::FBNNetwork.Graph(FBNcellcyclenetwork)
   resultfile <- reconstructTimeseries(FBNcellcyclenetwork,
                                    initialStates,
                                    type = "synchronous",
                                    maxTimepoints = 43,
                                    useParallel = FALSE)

   similarreport <- generateSimilaryReport(trainingseries,resultfile)
   print(paste("ErrorRate=",similarreport$ErrorRate,sep = "",collapse = ""))
#> [1] "ErrorRate=0"
   print(paste("AccurateRate=",similarreport$AccurateRate,sep = "",collapse = ""))
#> [1] "AccurateRate=1"
   print(paste("MissMatchedRate=",similarreport$MissMatchedRate,sep = "",collapse = ""))
#> [1] "MissMatchedRate=0"
   print(paste("PerfectMatchedRate=",similarreport$PerfectMatchedRate,sep = "",collapse = ""))
#> [1] "PerfectMatchedRate=1"

   #get attractors
   genes <- rownames(trainingseries[[1]])

   attractor <- searchForAttractors(FBNcellcyclenetwork,initialStates,genes)
   print(attractor)
#> Discovered Attractors via Fundamental Boolean Model :
#> Genes are encoded in the following order::
#> Gene1 Gene2 Gene3 Gene4 Gene5:
#>
#> Attractor 1 is a simple attractor consisting of 1 state(s):
#>
#> | --< - - - - - |
#> v               ^
#> 0 0 0 0 1       |
#> |               |
#> v               ^
#> | - - - - - >-- |
#>
#>
#> Attractor 2 is a complex attractor consisting of 4 state(s):
#>
#> | --< - - - - - |
#> v               ^
#> 1 0 0 0 0       |
#> |               |
#> 1 0 0 0 1       |
#> |               |
#> 1 1 0 0 1       |
#> |               |
#> 1 1 0 0 0       |
#> |               |
#> v               ^
#> | - - - - - >-- |
#>
#>
#> Attractor 3 is a simple attractor consisting of 1 state(s):
#>
#> | --< - - - - - |
#> v               ^
#> 0 0 1 1 1       |
#> |               |
#> v               ^
#> | - - - - - >-- |
#>
#>
#> Attractor 4 is a complex attractor consisting of 5 state(s):
#>
#> | --< - - - - - |
#> v               ^
#> 1 0 1 1 1       |
#> |               |
#> 1 0 1 0 1       |
#> |               |
#> 1 1 1 0 1       |
#> |               |
#> 1 1 1 0 0       |
#> |               |
#> 1 0 1 1 0       |
#> |               |
#> v               ^
#> | - - - - - >-- |
   #display the dynamic trajectory of the attactor 2
   FBNNetwork.Graph.DrawAttractor(FBNcellcyclenetwork,attractor,2)